Five Questions about Sensor Accuracy, Answered
By: Dustin Olender PhD, Director of Strategic Development - AML Oceanographic
Ever wonder what the numbers on sensor data sheets really mean, and how they are calculated? Read on!
Before you begin: AML prefers to use the International Vocabulary of Metrology (VIM, currently in the 3rd Edition), which covers a wide range of definitions used in metrology (the scientific study of measurement), such as trueness, precision, bias and drift. You’ll see these terms often in the explanations below, and blog posts by Dustin to come.
What is the definition of accuracy?
Is there a standard for accuracy?
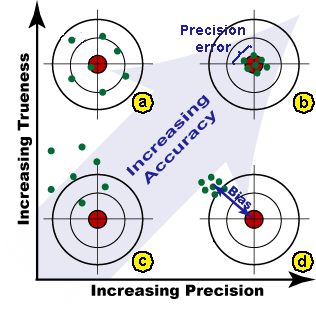
Figure 1: Bull’s-eye targets demonstrating the concept of trueness and precision. Here replicate measurements are green dots and the reference standard is the large red dot (or Bull’s-eye).
Precision is the closeness of agreement between replicate measurements. Analogous to accuracy it’s expressed numerically as “imprecision”. Precision error is calculated using the statistic of standard deviation (more on this in Q#3).
Trueness is the closeness of agreement of the average of many replicate measurements relative to a reference standard. Expressed numerically as an “intrueness”, that average error is known as bias.
Why would you want to discuss error this way? One explanation starts by looking at the various sources of error and their characteristics.
Ever hear that hissing sound in the background when listening to music? You may be listening to something called “thermal noise”, which is a random fluctuation of electrons, measured as voltage, in all electronic circuits. It sometimes gets amplified along with the audio signal. The circuits within marine sensors can require significant amplification, being even more sensitive to thermal noise. This is a good example of a precision error in a sensor.
Listen to thermal noise here.

Biofouling causes conductivity sensors to read lower than they otherwise would.
Conductivity sensors use glass tubes as part of their sensing elements. If seagrasses or other sea creatures are allowed to grow on the glass during deployments in tropical waters, the sensors read lower than they otherwise would[1]. The error increases as fouling increases. This error is referred to as “systematic”, because it affects all measurements similarly – forcing them low. It’s a good example of the bias that can develop in a sensor.
[1]Remember to use our UV anti-fouling technology for long deployments and this won’t be an issue!
IN OTHER WORDS
Imagine that your new puppy has ripped open a pillow while you were out of the room. You pick it up, and the feathers flow out. If the air is still, the feathers will land randomly around your feet. This is precision error. If you have a window open, however, and there is a slight breeze blowing in the direction of your kitchen, the feathers will all land off to one side. Due to the breeze, the feathers’ landing spots are biased towards a certain area. This is bias.
How do you quantify precision error? Or what standard deviation (SD) or RMS error?
If you look at the replicate measurements (green dots) near the bull’s eye at the bottom of Figure 2, you can see they’re grouped around a mean. It’s straightforward to calculate the mean (and the bias), but how would you calculate the precision error due to the random fluctuation around the mean?
The most common way to quantify precision error is to calculate the average distance of all these measurements from the mean. The field of Statistics does so in a particular way, calculating the square root of the average of squared errors, or root mean square (RMS) error. This is also known as the standard deviation (SD), and is sometimes symbolized as σ.
If you were to make many replicate measurements and stack those with similar size errors, you would eventually see the graph at the top of Figure 2. From this one can conclude that the chance or probability of a measurement being close to the mean is high, falling off the farther you get from it.

Figure 2: Dispersion of replicate measurements associated with precision. Note: only 3 stacks were shown for clarity.
Practically this means that 1 SD (1σ) tells us the error will be within that distance of the mean, 68% of the time – or the vast majority of the measurements. The value of an SD is often prefixed by ±, to indicate that it is a “half-width”, and the error could be either positive or negative. For a 95% probability, one can multiply the SD by 2. For a 99.7% probability, one can multiply the SD by 3, and so on. AML follows the field of Statistics, preferring the RMS error and reporting 1σ.
What is initial accuracy?
After a successful calibration, sensors are initially true, having a bias less than their precision error (a state visualized in Figure 1b). This means that the precision component of accuracy dominates, and is what AML reports as accuracy in their datasheets. This is sometimes referred to as “initial accuracy” or “calibration accuracy” because it is the accuracy immediately following calibration.
How does AML determine the accuracy of a sensor model?
To test for accuracy, one needs a reference standard of preferably higher accuracy than the sensor under consideration[1]. Manufacturers spend considerable time and effort on developing and maintaining the apparatus involved, and AML is no different. For manufacturers of marine sensors, a reference standard often includes a body of water with the parameter of interest (sound velocity, conductivity, temperature, etc.) held constant in time and space.

Testing one sensor across a wide range of temperatures. This process is carried out for at least five sensors of the same model to determine the accuracy.
As noted in the answer to Q#4, after calibration the bias must be smaller than the precision error of the sensor at all 3 levels[1]. AML calculates the precision error of multiple sensors (often called reproducibility) and reports it as accuracy in our datasheet. Of course, using multiple sensors adds significant variability to the assessed value of accuracy (typically a factor of 2 or more) but has the benefit of giving our customers a realistic value of what they would expect to see if they compared two of our sensors in the field. Additionally, AML calls the precision error of a single sensor its repeatability and have historically listed it as “precision” in our datasheets.
[1]The accuracy of some sensors is dependent on level. Turbidity is a good example of this. In those cases the accuracy is expressed as an equation dependent on the magnitude of the measurement.

Accuracy = the average of the precision error of multiple sensors
Precision = the precision error of a single sensor
Learn how AML can make a difference for you.
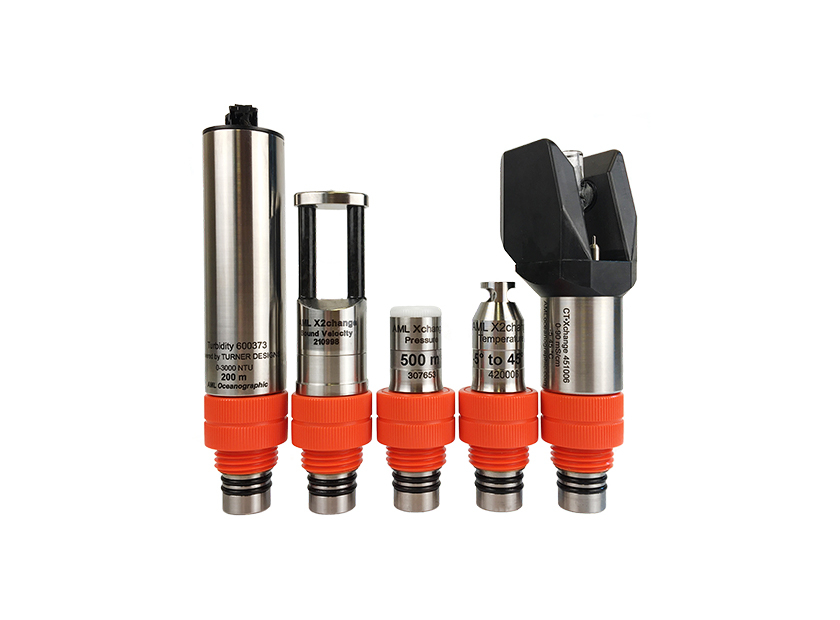
X2change™ is the industry’s leading family of field-swappable sensor heads. Each sensor head contains its own embedded calibration and can be moved from instrument to instrument without impacting accuracy. Changing sensors is easy: simply unscrew one sensor head and replace it with another.