Foul Free at Folger Pinnacle
UV•Xchange™ Protects Sondes at Ocean Networks Canada's Cabled Observatory for Over Two Years
By: Jehan Zouak, Marketing Coordinator - AML Oceanographic

"With the incredible results of the AML Oceanographic CTD and UV anti-biofouling system in our technology demonstration program we are very pleased to be deploying these systems across coastal BC as part of the Smart Oceans™ program. High biofouling areas in the coastal zone create a huge challenge in ongoing operations and maintenance costs for any observatory, especially in remote locations. After 15 months and still going, at our worst bio-fouling site, the sensors remain clean and operating fine. We are all absolutely amazed. AML Oceanographic has really made a revolutionary advance in anti-biofouling technology with this new product."
Scott McLean
Director of Ocean Network Canada's Innovation Centre
Background
Biofouling, the unwanted growth of marine organisms, is the principle factor limiting the duration of deployments of submerged equipment. Underwater sensors, cameras, connectors, lights, windows, and other surfaces or structures are susceptible to marine growth that renders them ineffective. In some environments, biofouling is so intense that cleaning or other mitigation strategies are required on a weekly basis.
Manual cleaning, servicing, or replacement of underwater equipment on a regular basis is costly and in some locations impossible. For this reason, the ocean sensing industry has spent considerable effort over many years to develop in-situ biofouling control technologies that allow the sensors or devices to remain functional in the field for extended durations uninhibited by marine growth. The biofouling control technologies resulting from these efforts can be broadly categorized into three groups: 1) volumetric chemical dosing techniques, 2) surface coatings and treatments, and 3) mechanical methods. Their shortcomings led AML to develop a UV-based technology that is non-toxic, non-contact, and suitable for the complex geometries often found on subsea equipment.
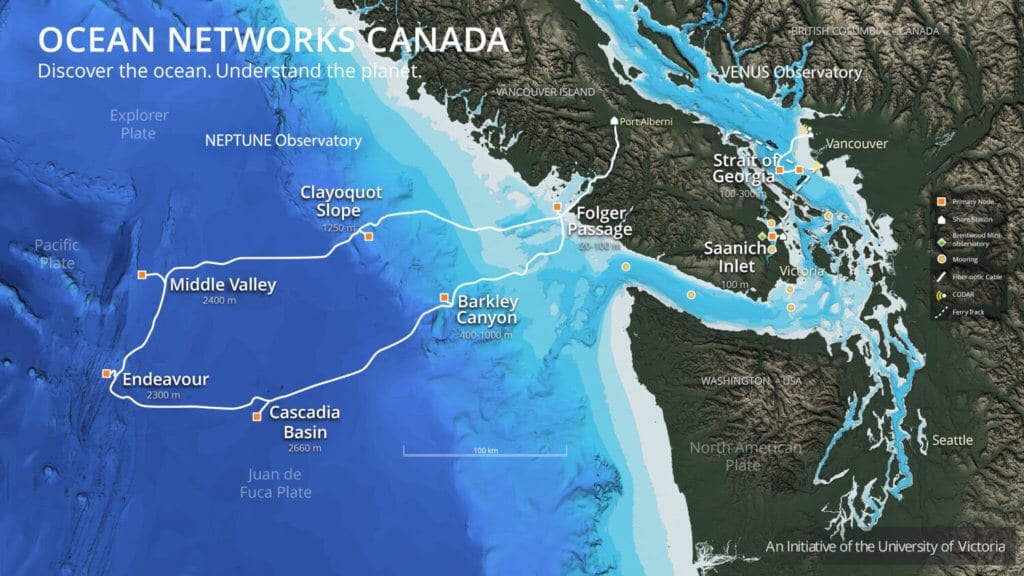
Map of the Folger Pinnacle. Located off the coast of Vancouver Island, the shallow depth and nutrient-rich waters make the Folger Pinnacle an ideal biofouling test bed. Image courtesy of ONC.
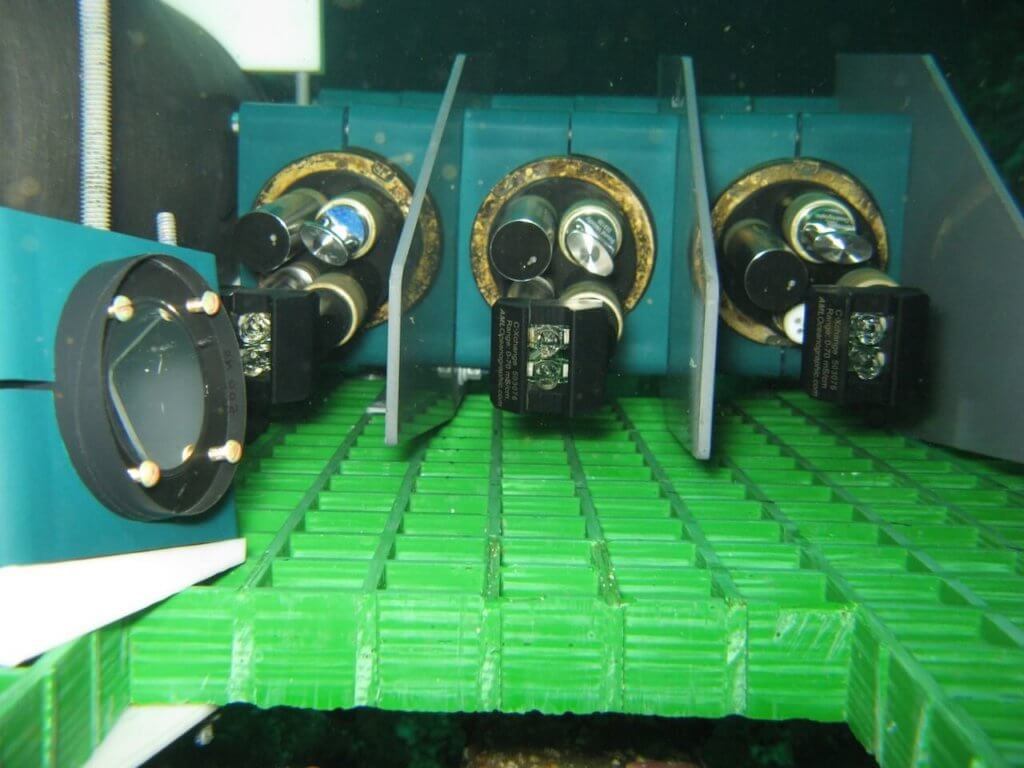
AML equipment when first deployed. From left to right: UV2, UV1, and Control CTDs, October 2013. Instruments UV1 and UV2 are UV•Xchange-equipped sondes with LEDs aimed at the sensing structures of the adjacent conductivity, turbidity, and sound velocity sensors. The UV•Xchange devices are obscured by the conductivity sensors from this angle. Photo courtesy of Ocean Networks Canada.
As shown above, three instruments were deployed directly adjacent to one another. Two of the instruments were equipped with UV•Xchange and one was left unprotected as a control. Baffles were placed between adjacent sondes to prevent ‘spillover’ UV light from one instrument to the next. Each instrument was equipped with a conductivity sensor, a time of flight sound velocity sensor, and a turbidity sensor. The control sonde was also equipped with a pressure sensor.
Data were recorded from each instrument at a frequency of 1 Hz and a controllable underwater camera was available to visually document the progression of the biofouling.
Visible Results of UV Biofouling Control
As expected, growth on the platform was rapid. Sensor readings from the control sonde demonstrated clear errors due to fouling within a few weeks. Within a few months, the instrument was enveloped in marine growth. The sensors of the UV-protected instruments, in contrast, remained in agreement within their published accuracies. Still images from daily video records were collected and stitched into a time lapse video showing 480 days of progress.
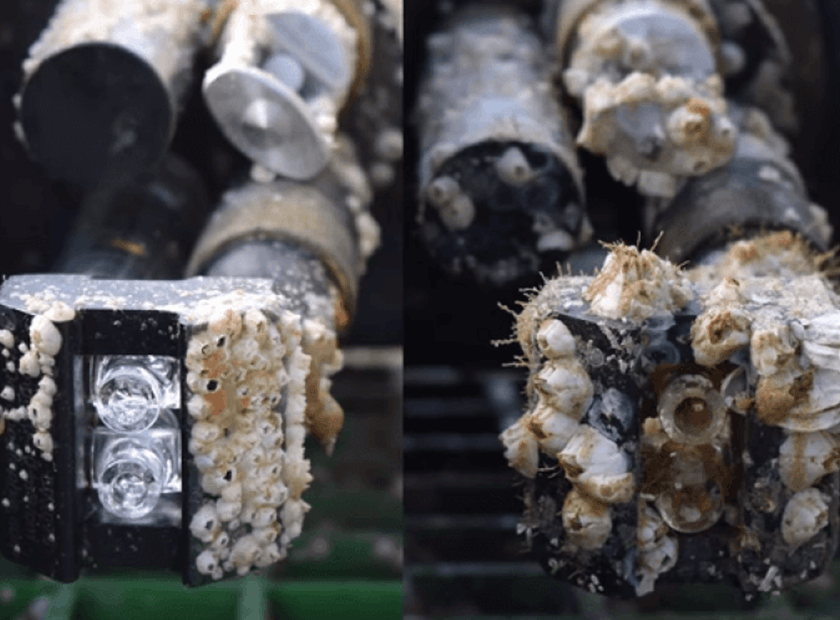
During regular maintenance of the Folger Pinnacle instrument platform in July 2014, AML’s CTD test rig was pulled up along with the other oceanographic equipment. UV2’s conductivity sensor and one LED module was replaced at this time* but no other service, calibration, or cleaning was done. The image below shows effective biofouling prevention in UV1, UV2, whereas heavy fouling is seen on Control CTD.
*In April 2014, an LED module on UV2 failed due to a poor solder connection. As a result, the sensor it had been protecting, the C•Xchange conductivity sensor, began to foul. The appearance of its glass tubes after two months of fouling contrasts starkly with the pristine glass tubes of the C•Xchange on UV1 which were protected for the entire nine months.
After nine months of deployment: AML equipment from left to right: UV2, UV1, and Control CTDs, June 2014. Photo courtesy of Ocean Networks Canada
The sensing surfaces of the conductivity, turbidity, and SV sensors of instruments UV1 and UV2 remain clear of fouling, confirming successful biofouling protection from the UV•Xchange systems. Areas which do not have direct line of site with the UV systems are fouled, such as the top (non-critical) surfaces of the conductivity sensors. Additionally, there are clear foul-free sections on the plastic baffles between instruments from incidental UV spillover. Also visible on the baffles is the clear demarcation between protected and non-protected areas, indicated by the abrupt lines of growth. The control sonde (far right) exhibits heavy fouling on all sensors. Photo used with permission from ONC.
The instruments continued to function (foul-free) for 26 months. The camera feed ceased when the platform was heavily damaged by a series of storms rolling through the area. The wave action was intense enough to tear the camera sphere and accompanying equipment off of the observatory platform, at which point the observatory suffered a complete power failure. The image at right was captured prior to the loss of the platform.
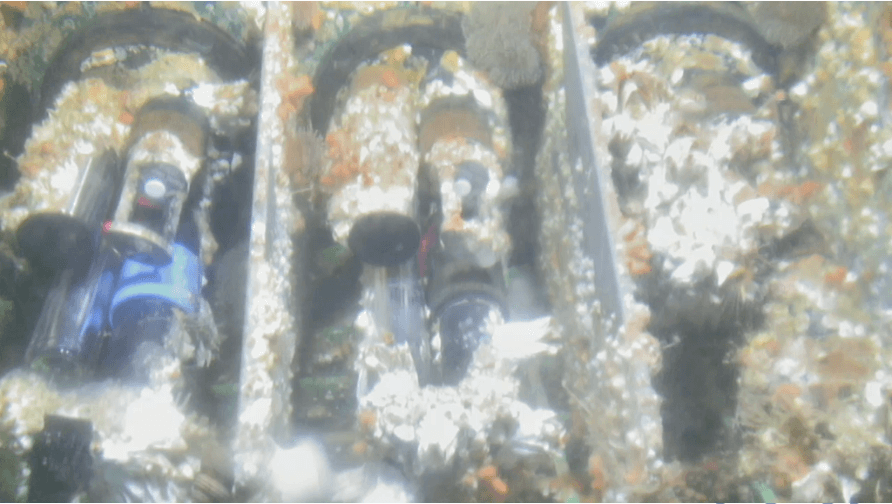
After 26 months of deployment: AML equipment from left to right: UV1, UV2, and Control CTDs, November 2015.
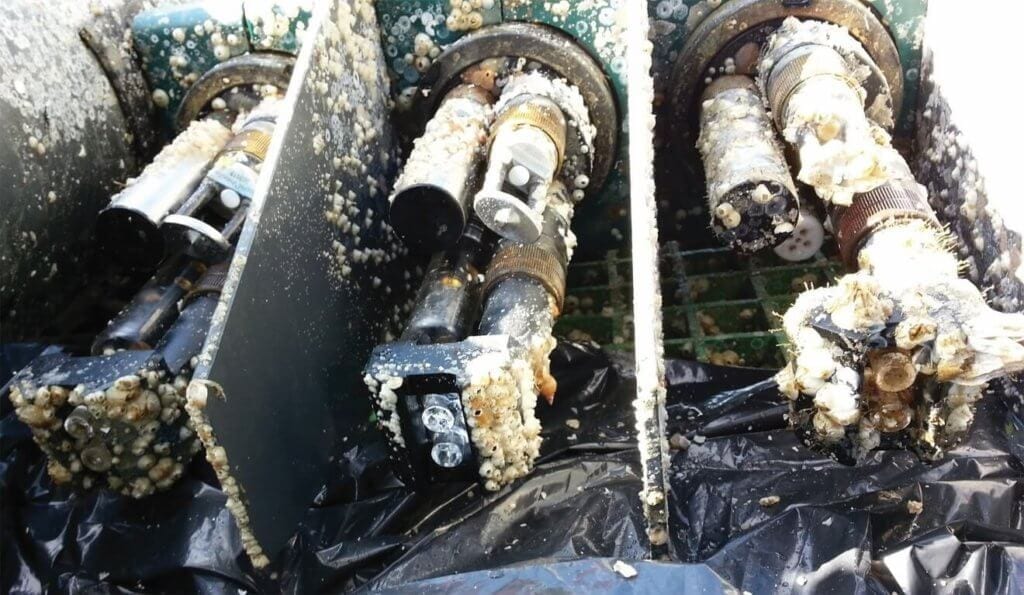
The platform was recovered from the pinnacle in April of 2016. The image below shows the test rig post deployment. Of note is that the rig was unpowered between the winter storm event in late 2015 and the platform recovery in April 2016. Again, the UV protected sensor surfaces show the effectiveness of the antifouling system.
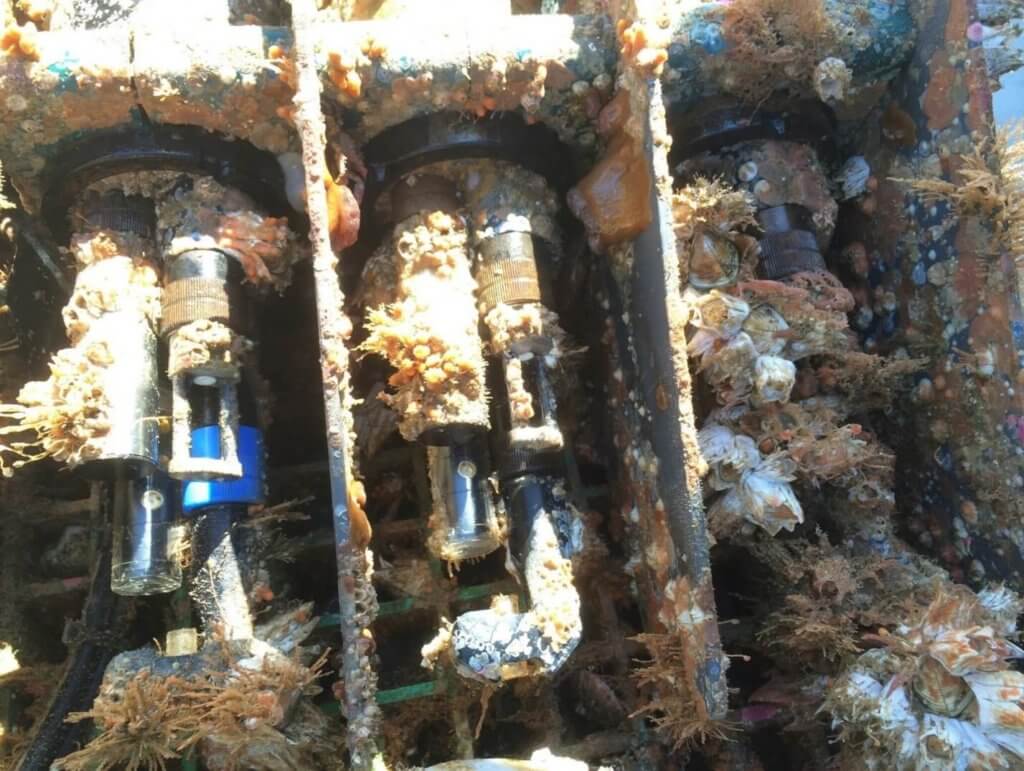
Recovery post deployment: AML equipment from left to right: UV2, UV1, and Control CTDs, April 2016. The sensing structures of the UV-protected sensors (left and center instruments) remain free of fouling after 30 months of deployment. In contrast, the control sonde is unrecognizable as an instrument. Photo courtesy of Ocean Networks Canada.
Biofouling Control Results: Two Years of Time Series Data
In addition to the visual record of the fouling, sensor readings were monitored and compared over time to assess UV’s effectiveness at eliminating biofouling-induced measurement error. Data from the AML CTD test rig were collected and compared against a reference CTD using a TBT-based biofouling control technique. The graph below shows the conductivity data trends, and a few notable events are highlighted.
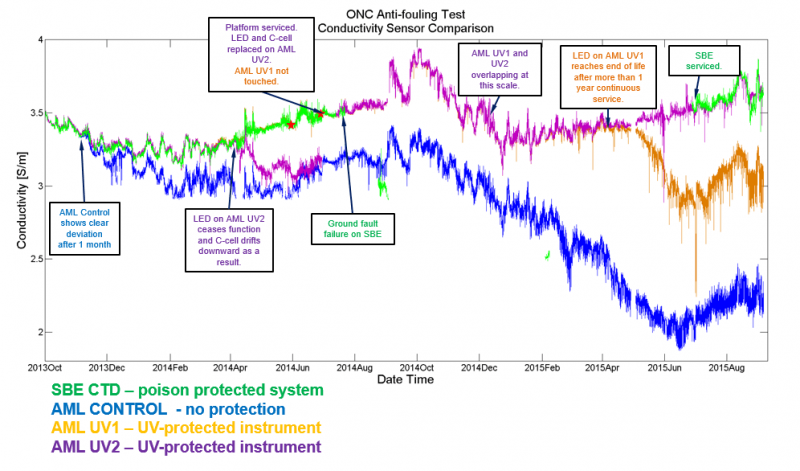
Plot of readings from conductivity sensors of the three AML instruments in addition to readings from a reference CTD on the platform. UV1 and UV2 are shown in orange and purple, respectively. The control (unprotected) conductivity sensor is shown in blue. The reference sensor is shown in green. Image courtesy of Ocean Networks Canada.
- Start of deployment: All sensors working and in agreement with each other within the total error budget
- Event 1: AML Control (lacking any biofouling control) drifts out of specification compared with UV-protected test sensors and TBT-protected reference sensor
- Event 2: LED wiring issue in UV2 results in loss of biofouling protection for conductivity sensor, causing UV2 to drift out of specification compared with UV1 and the TBT protected reference sensor
- Event 3: Platform service (see Figure 5) including replacement of UV2 LED module and fresh Conductivity Xchange™ No other cleaning, calibration, or maintenance.
- Event 4: Ground fault failure of TBT-protected CTD, resulting in long gap in reference data
- Event 5: UV1 and UV2 sensors (AML Conductivity Xchange™ sensors protected by UV•Xchange) are overlapping each other for the entire period where the TBT protected CTD data is missing, up to the next event.
- Event 6: UV1 conductivity drifts out of specification compared with UV2 as the protective LED reaches the end of its service life.
- Event 7: TBT-protected CTD is serviced and replaced. Readings are in line with UV2.
Conclusion
AML’s UV•Xchange is an attractive antifouling technology compared with other techniques currently being used as it is non-contact, non-chemical, and contains no moving parts. This technology demonstration is further confirmation of the technique’s effectiveness at preventing biofouling on sensors in long term in-situ deployments, enabling optimal performance and the expansion of monitoring timelines.
Learn how UV Biofouling Control can make a difference for you.
Whether it is preventing biofouling-induced drift to keep sensor data accurate, or keeping a camera lens clean to maintain a quality image, our UV antifouling technology optimizes the performance of the instrumentation that it is employed to protect.